
Email Analytics: How to Evaluate the Effectiveness of Your Email Campaigns
What’s the purpose of email analytics? First, it allows you to look at an email through the eyes of your audience: what they notice, what they click on, and what they leave without attention. Second, it provides data for further decisions about email content and design.
In this article, we take a look at email campaign analytics: how it works in Pixcraft and what practical value it provides.
What Metrics Are Used in Email Campaign Analytics
Email analytics is not a new invention. Email has been a popular communication channel between brands and customers for many years. Over time, numerous ways to evaluate campaign performance have emerged.
The main metrics include:
- Delivery Rate. The percentage of emails successfully delivered to recipients’ inboxes: (Delivered / Sent) × 100%.
- Open Rate (OR). The percentage of recipients who opened the email. It's calculated based on the number of delivered emails: (Unique opens / Delivered) × 100%.
- Click-Through Rate (CTR). The percentage of recipients who clicked on one or more links in the email. Again, it's calculated based on the number of delivered emails: (Unique clicks / Delivered) × 100%.
- Conversion Rate. The percentage of readers who completed the target action: (Conversions / Selected calculation base) × 100%.
- Unsubscribe Rate. The percentage of readers who unsubscribed after receiving the email: (Unsubscribes / Delivered) × 100%.
However, these metrics are often not enough for a deeper analysis. This is why Pixcraft offers advanced capabilities for evaluating the effectiveness of your email campaigns based on the required parameters.
How Analytics Works in Pixcraft
The foundation of Pixcraft's email analytics is tracking pixels. These are invisible images used in both HTML and AMP emails. When a pixel loads, it sends a request to the server with parameters that indicate what event occurred and which subscriber triggered it.
In HTML emails, a pixel is added as a regular image (<img>) or as a background image (background-image). An <img> element usually loads and dispatches an event when the email itself loads, while a background-image loads only when it's displayed. This means that image loading, and therefore event dispatch, can be controlled using CSS and media queries.
The principle is the same for AMP emails, except that the <amp-img> tag is used instead. It's better to place it at the beginning of the email since AMP images are loaded asynchronously. For the pixel to work correctly, it must also be located within the visible area of the email; otherwise, it will not load.
Events are tracked using special parameters. By combining them, you can build clear performance metrics:
e (event_name): Indicates the event type. Pixcraft uses view for standard email open tracking and time for tracking the time spent in AMP emails. For custom events, you can use any other names.ea (event_action): Defines an additional event parameter. For example, for aviewevent, this parameter containshtmlwhen the HTML version is opened andampwhen the AMP version of the email is opened.ev (event_value): An additional parameter for numeric values. For example, when tracking the amount of time spent in an email, this parameter is used to track the number of seconds.
The following parameters are also used to identify the event:
trkid: the unique identifier of the analytics campaign. It's generated automatically when the campaign is created in Pixcraft.cid: the recipient identifier used to distinguish unique events from repeated ones. Here, you need to use your email service provider’s personalization variable containing a unique user identifier (for example,{lead._md5}for Altcraft or{{SubscriberId}}for Unisender).
Open tracking works according to the scheme described above: the email is opened, the tracking pixel is activated, and the data is sent to the server. Keep in mind that email client image-loading settings and privacy protection mechanisms may affect open tracking.
To measure the time spent in an email, Pixcraft uses a hidden amp-carousel component with automatic scrolling. The carousel switches between tracking pixels at specified intervals, and specific pixels show how long the email remained open. For example, the following time points can be tracked:
1 → 3 → 5 → 10 → 15 → 20 → 25 → 30 → 40 seconds
In this case, if the system received events at 1, 3, 5, 10, and 15 seconds but did not receive an event at 20 seconds, this means that the email remained open at least until the 15-second mark.
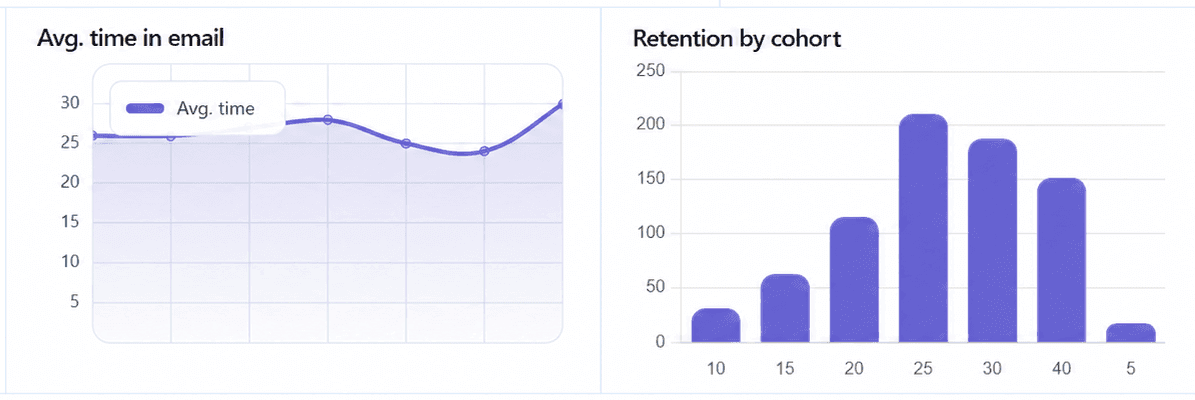
Based on the collected data, Pixcraft calculates the average time spent in the email and generates audience retention data.
How to Enable Email Analytics
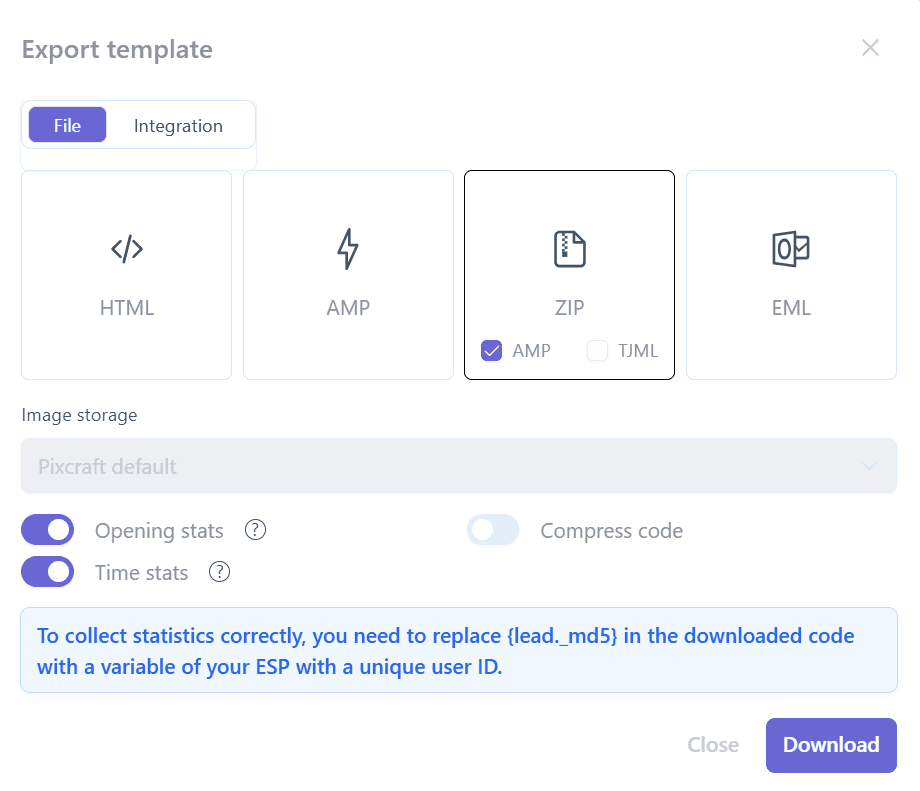
If you create emails using the Pixcraft builder, you can enable open and time tracking during export.
For example, select ZIP archive export, enable open and time statistics at the bottom, then select the checkbox next to AMP and click Download. The archive will contain two versions of the email. Both opens and time will be tracked for the AMP template, while only opens will be tracked for the HTML version.
Important! Statistics are unavailable for EML emails because this format is intended for manual sending without any personalization tags.
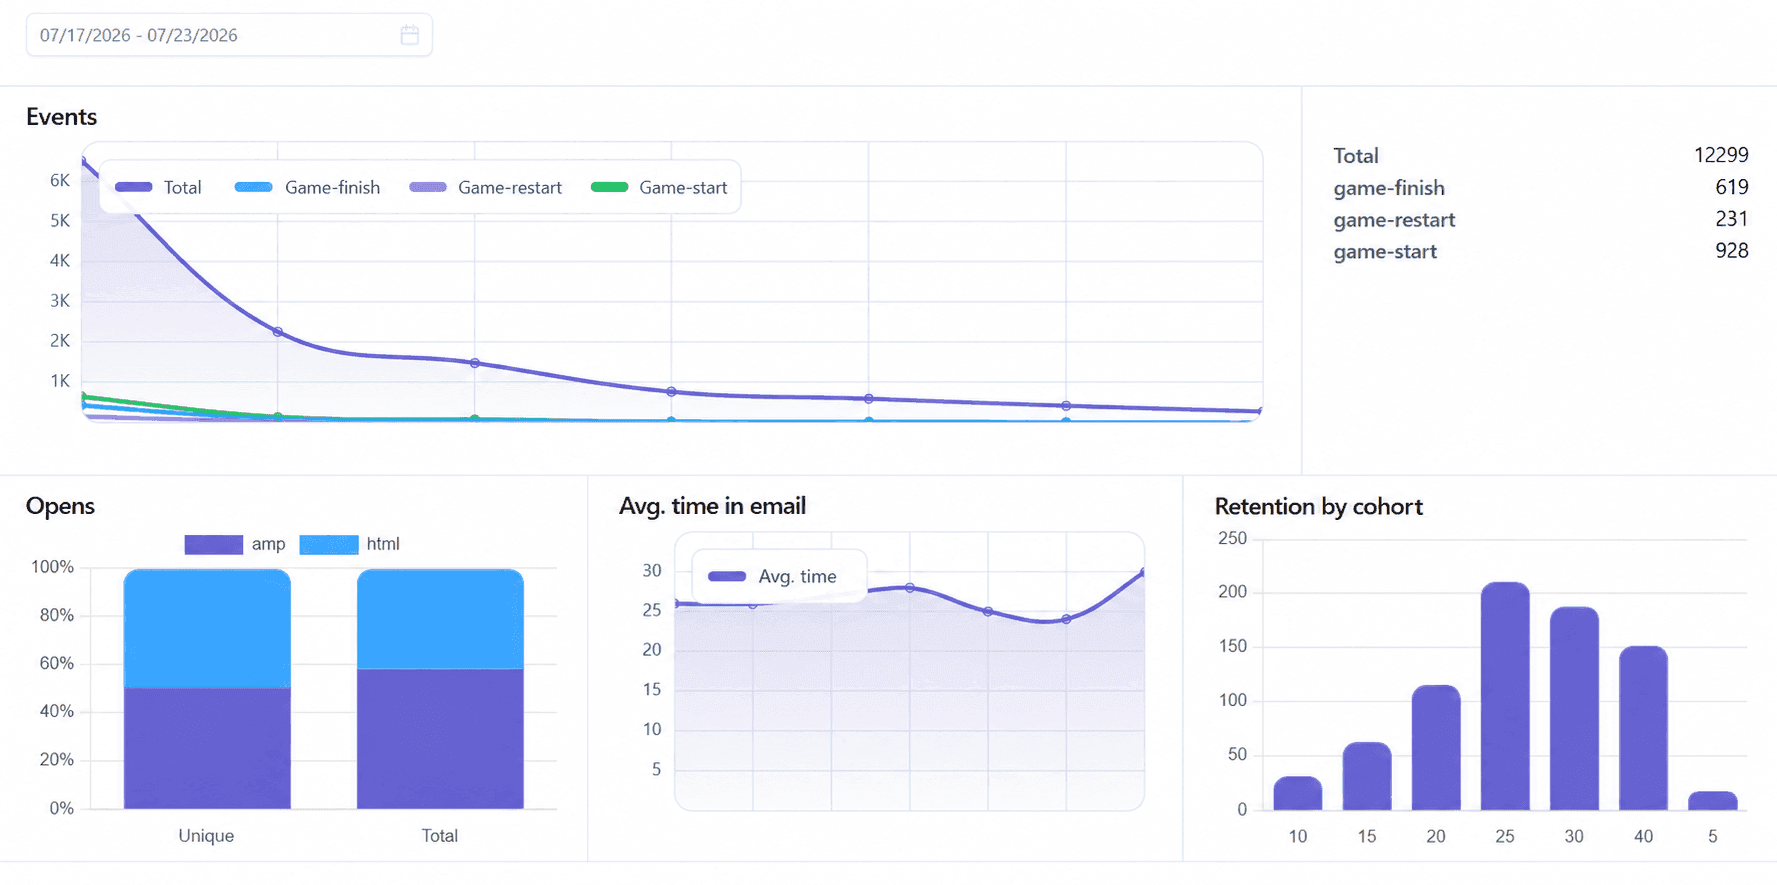
In this case, an analytics campaign for the downloaded email template will be created automatically in the Analytics section. The data is displayed as charts in the Statistics tab:
- Events. A chart showing the total number of events. Each event is displayed separately in the legend, while the total number of events is also shown in the Total panel on the right.
- Opens. The number of email opens, both unique and non-unique. A separate breakdown of HTML and AMP email opens is also available.
- Average time in email. The average time in seconds that users spent in the email, broken down by day.
- Retention by cohort. A chart showing audience retention based on the time spent in the email.
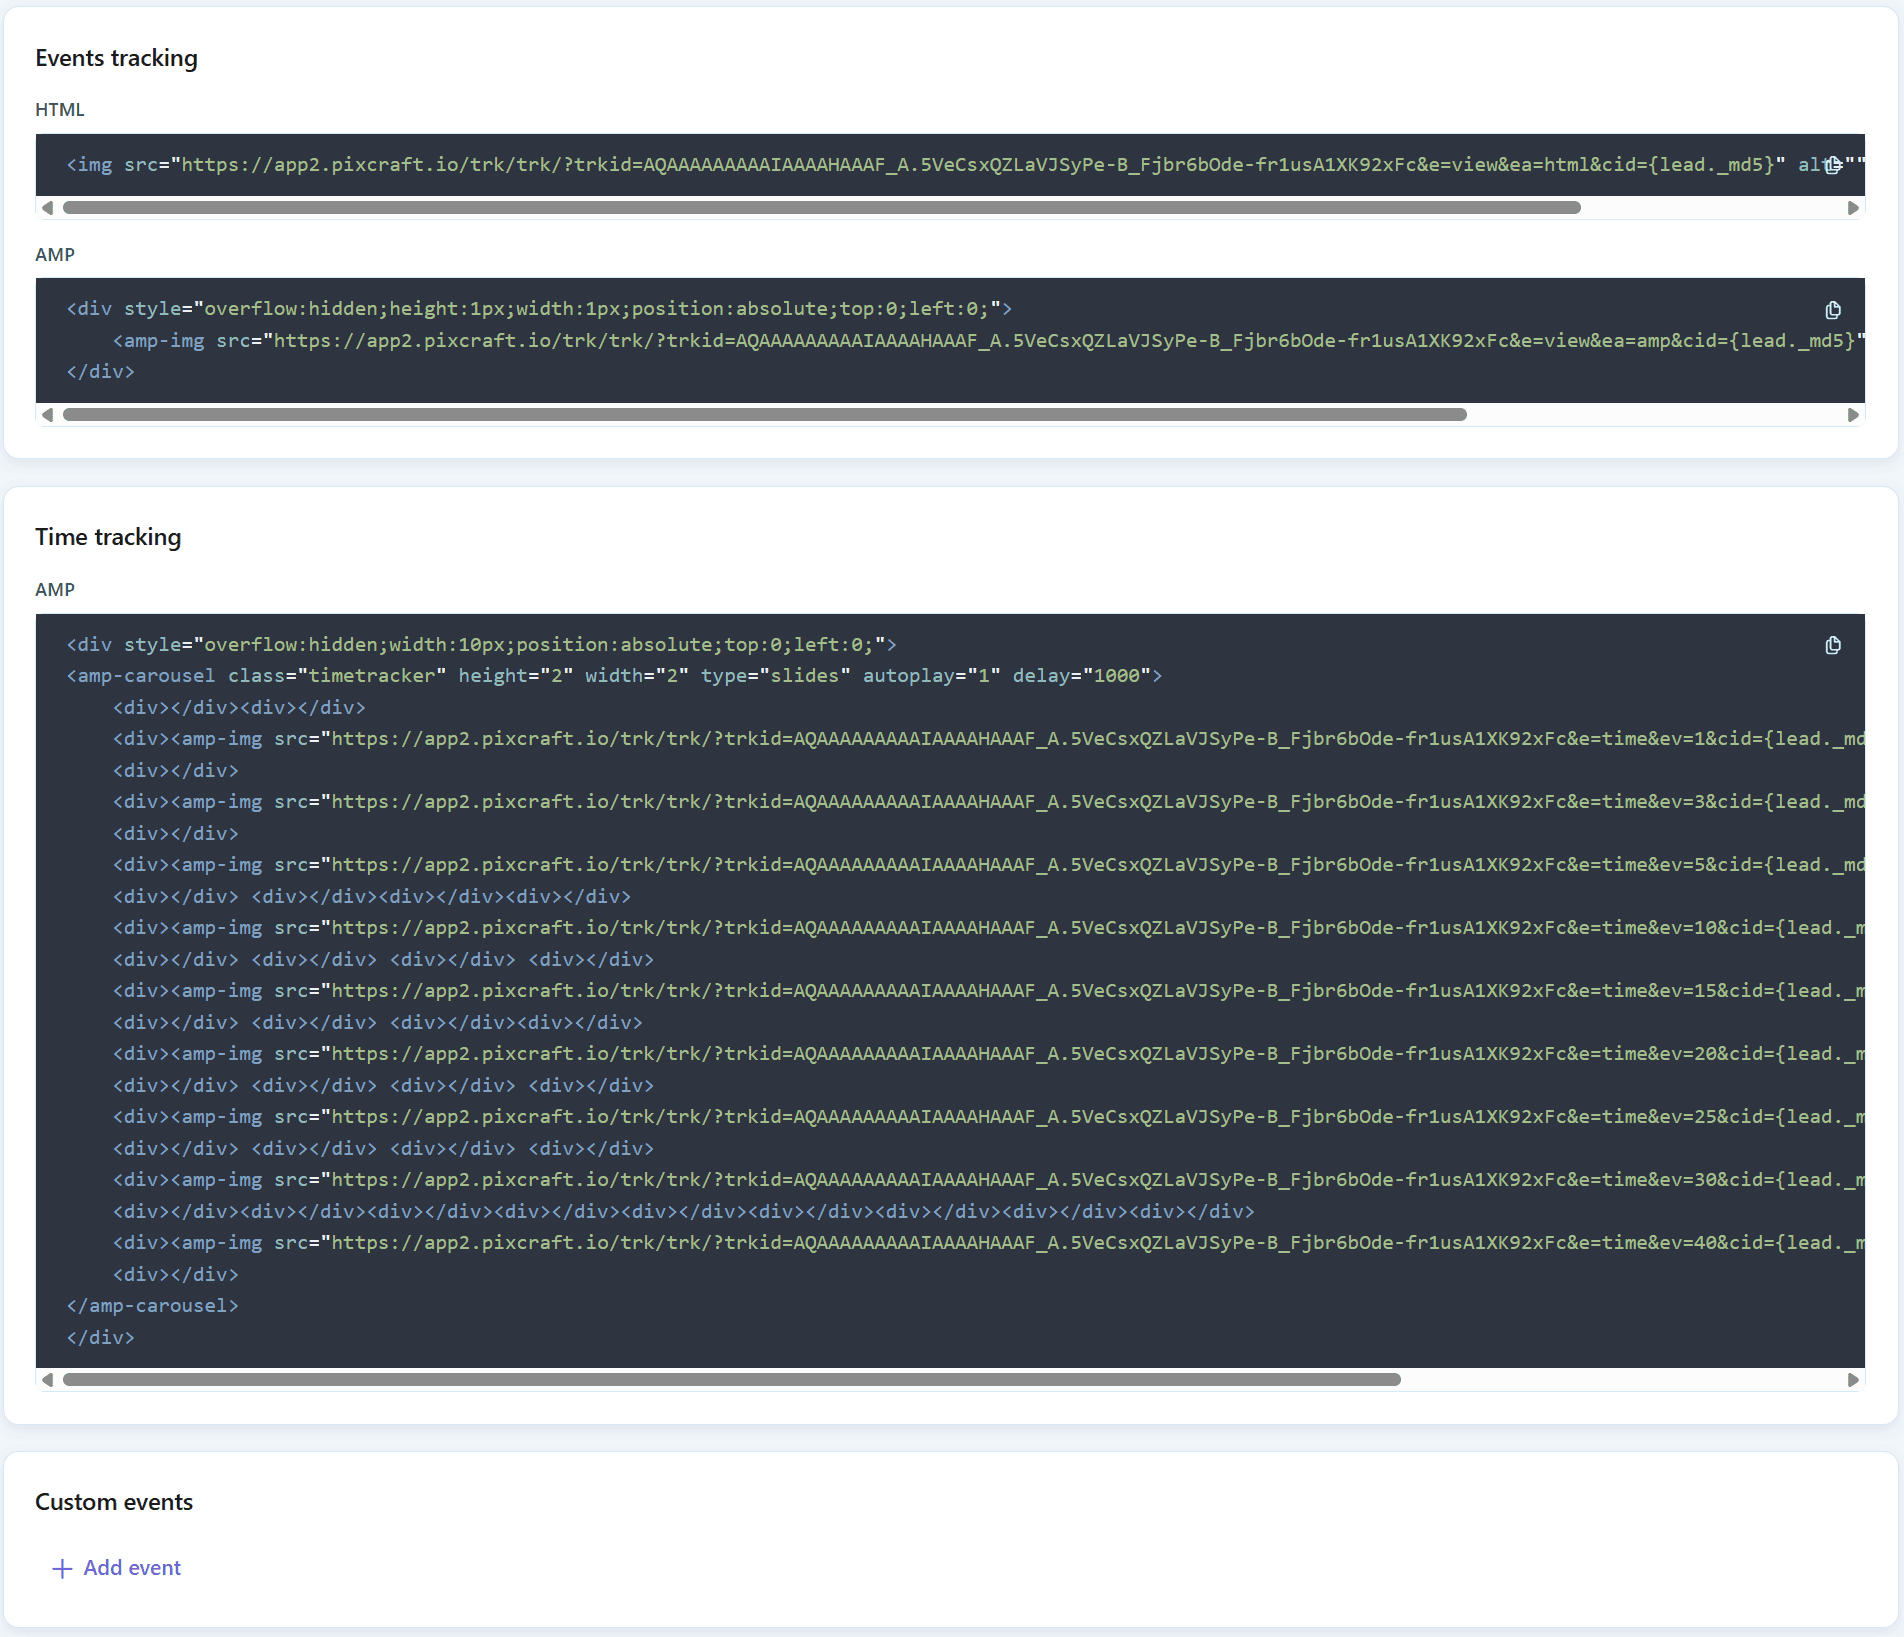
However, even if you design emails manually, you can still connect them to Pixcraft analytics. To do this, create a new analytics campaign and add tracking pixels to the email template code.
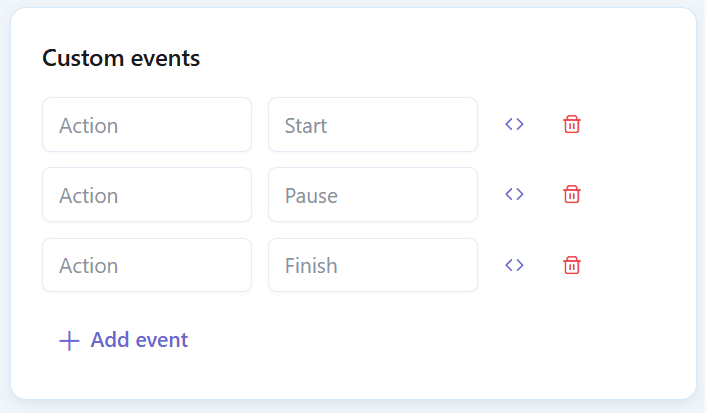
In the Analytics section, click New Campaign, enter its name, save it, and go to the Connection tab, where the tracking pixels are located. Directly below them is the custom events configuration block.
How Custom Events Work
Creating a new event is easy: click Add Event and specify its name and action. Then click <>, copy the generated code, and add it to the email template.
However, the code itself does not determine what action the recipient performed. If you simply insert it into the email template, it will load alongside the rest of the content, and Pixcraft will immediately register the event.
To track a specific action, the pixel loading must be tied to the required condition in the email code. The logic is as follows: action or condition → tracking pixel loads → event is registered in Pixcraft.
Custom Events in AMP
AMP technology offers extensive possibilities for tracking interactions inside an email. Tracking pixel loading can be tied to a user action or a specific stage of a scenario:
- the total number of clicks in the email;
- completion of AMP games, tests, and surveys;
- interactions with product cards;
- transitions between states of an interactive block;
- clicks on elements that do not contain links.
In this case, the AMP code determines when exactly the pixel is loaded, while Pixcraft receives the request and records the corresponding event. For example, in an email containing a survey, you can create separate events for:
- starting the survey;
- moving to the next question;
- receiving the result;
- clicking the final button.
As a result, you can see how many recipients started interacting with the survey, how far they progressed, and at which stage they stopped most often.
Custom Events in HTML
In HTML emails, CSS acts as the trigger that launches the tracking. Its properties can be configured so that the tracking pixel loads when a specific condition is met rather than immediately after the email is opened.
For example, :hover can be used to load the pixel when the cursor moves over a particular element and to evaluate how many users read the email to the end. In this case, the pixel is defined as a background image through CSS, then added to the lower part of the template and activated when the user hovers over the element.
Another scenario involves media queries. The pixel can be displayed only at a specific screen width or height, screen orientation, or PPI (pixels per inch) density. Based on the resulting events, you can evaluate, for example, the percentage of opens on mobile devices.
Other conditions can be analyzed in a similar way. For instance, events can be tracked when dark mode is enabled in email clients that support the relevant CSS conditions.
The limitation here lies in the capabilities of email clients themselves, particularly their varying support for media queries and CSS properties.
How to Use Analytics Data in Practice
Email metrics data is a treasure trove for marketers. But it's only useful when analyzed regularly and applied in practice:
- Optimizing email structure. The audience loses interest before reaching important parts of an email? This is a reason to reconsider the content order, text length, and CTA placement. If certain elements consistently receive more attention, you can place additional emphasis on them.
- Comparing different presentation options. For example, you can compare emails with different structures, text lengths, numbers of offers, or placements of primary CTAs and see how the recipient behavior changes.
- Understanding audience interests. When preparing future campaigns, you can take into account how recipients reacted to different content groups. For example, you can show particular product categories or content topics more often to users who have previously expressed interest in them.
- Setting priorities. If tracking shows that a significant share of emails are opened on smartphones, it’s worth paying particular attention to the mobile version and the placement of elements on smaller screens. Similarly, you can evaluate the share of opens in dark mode or in specific email clients and determine if it’s important to adapt your emails to these conditions.
At the same time, a single event is often not enough. It’s better to draw conclusions based on a series of email campaigns and compare several metrics at once: the same recurring pattern can become a reason to change email content, structure, or design.
Conclusion
The value of analytics lies less in the number of events collected and more in how practical and meaningful they are. Therefore, analytics should be treated as part of the work on the email itself: formulate a question or hypothesis, select goals and metrics, and then use the results when developing future email campaigns.
With Pixcraft, you get comprehensive capabilities for managing your email campaigns, from creating email templates to analyzing their performance. Try it yourself: sign up today to receive a free 14-day trial. And if you have any questions about our service, contact us by email.